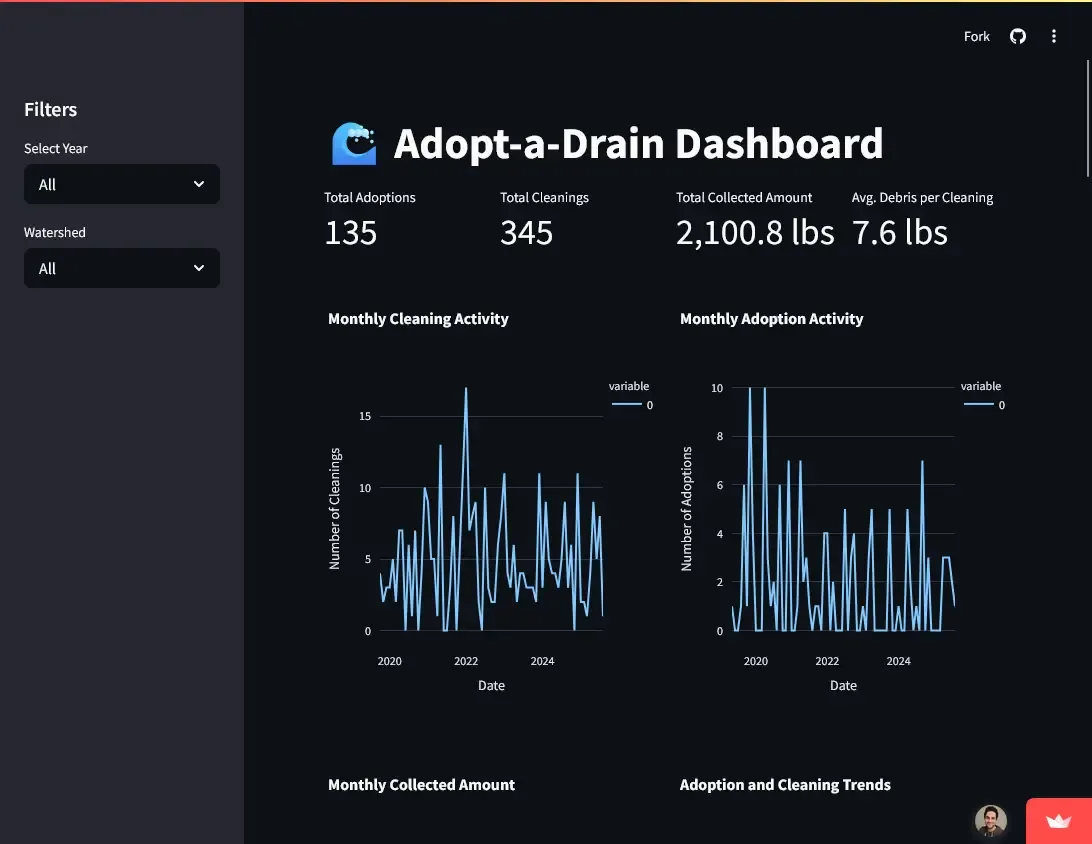
Adopt-a-Drain Dashboard
A Streamlit dashboard that visualizes volunteer impact and debris collection for Crystal, Minnesota's Adopt-a-Drain program. Transforms raw CSV data into compelling visual narratives for program justification and MS4 permit reporting.
Features
- Key Metrics Dashboard: Total adoptions, cleaning events, and debris weight collected
- Geographic Visualization: Interactive map showing cleaning locations and neighborhood engagement
- Temporal Analysis: Monthly cleaning patterns and seasonal trends
- Data Filtering: Filter by year, watershed, and volunteer
- Professional Presentation: Error handling and loading states for stakeholder demos
Technology Stack
- Backend: Python with Pandas for data processing
- Frontend: Streamlit for rapid prototyping
- Visualizations: Plotly for charts and maps
- Package Management: uv for dependency management
- Data Sources: CSV exports from Adopt-a-Drain program
Impact
Over 2,800 lbs of debris prevented from entering local waterways, providing visual evidence to support continued program funding and simplify permit reporting.
Read "The Adopt-a-Drain Dashboard" on the Blog →
Screenshot
- ← Previous
NoteKeeper