Traffic Studies
A comprehensive traffic analysis dashboard for Crystal, Minnesota, built with Streamlit. This project processes and visualizes traffic data collected from PicoCount 2500 traffic counters, providing detailed insights into traffic patterns, speed compliance, and vehicle classifications.
๐ Features
- Interactive Map: PyDeck-powered location map with clickable traffic study locations and real-time metrics tooltips
- Multi-Page Navigation: Streamlined interface with dedicated map and analysis pages
- Interactive Dashboard: Real-time filtering by location, date range, and time periods
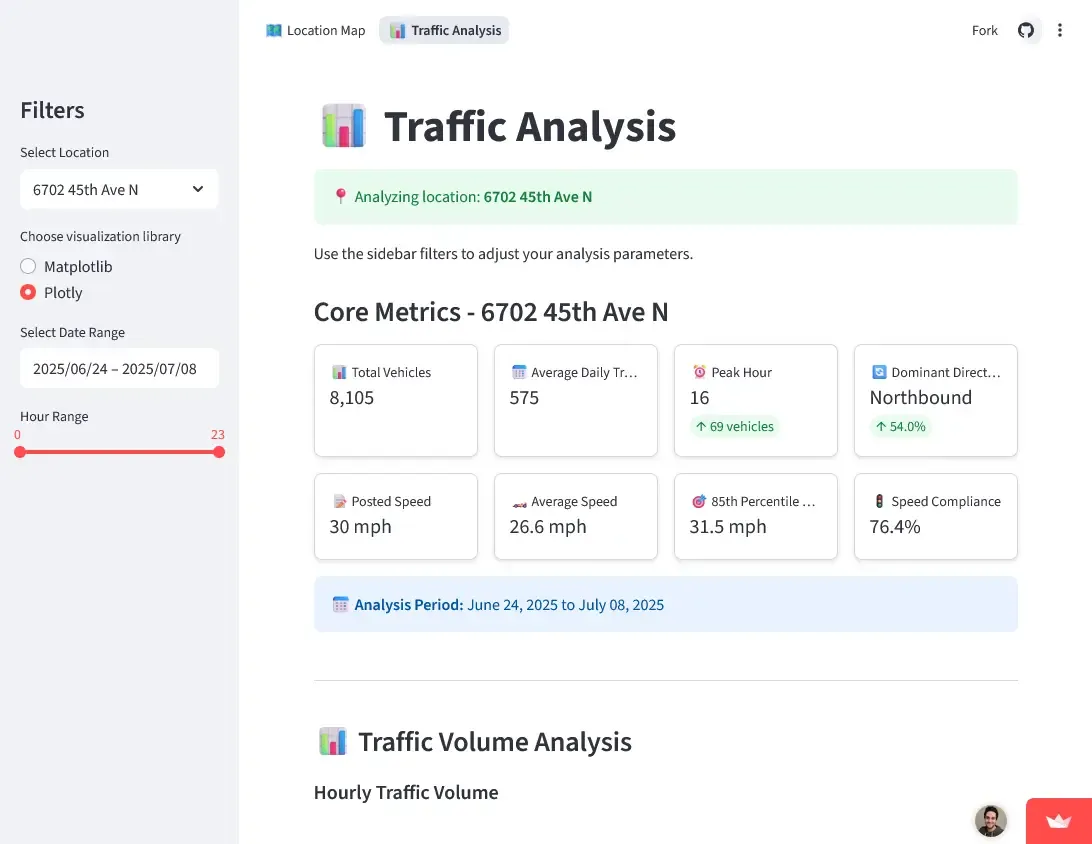
- Core Metrics: Essential key performance indicators including speed compliance, peak hour analysis, and traffic volume
- Chart Explanations: Interactive "See explanation" expanders under each visualization with detailed reading guides
- Vehicle Classification: Detailed analysis of 6 vehicle classes from motorcycles to heavy trucks
- Speed Analysis: Compliance monitoring, violation severity tracking, and 85th percentile calculations
- Temporal Patterns: Hourly, daily, and weekly traffic pattern visualization
- Enhanced Data Processing: Advanced validation, vectorized operations, and zero-traffic filtering
- Performance Optimization: Memory-efficient processing with intelligent caching and loading spinners
- Data Quality Monitoring: Comprehensive validation with detailed error reporting and statistics
๐ Core Metrics Dashboard
Essential Key Performance Indicators
- Total Vehicle Count: Aggregate count of all vehicles detected
- Average Speed: Combined directional speed analysis
- Speed Compliance Rate: Percentage of vehicles adhering to speed limits
- 85th Percentile Speed: Critical speed measurement for traffic engineering
- Peak Hour Statistics: Busiest hour identification and vehicle counts
- Dominant Direction Analysis: Traffic flow direction preferences with percentages
Traffic Analysis Visualizations
The dashboard features well-organized visualization sections with interactive explanations to help users understand and interpret the data effectively.
๐ Traffic Volume Analysis
- Hourly Traffic Volume: Stacked bar chart showing average vehicles per hour by direction, ideal for identifying peak commute periods
- Daily Traffic Patterns: Bar chart displaying traffic volume by day of week, useful for understanding weekly cycles and planning maintenance schedules
๐ Speed Analysis
- Speed Violation Severity: Categorizes speeding violations by severity levels (0-5, 5-10, 10-15, 15+ mph over limit) to prioritize enforcement efforts
- Speed Distribution by Direction: Dual charts showing vehicle speed distributions for each direction, helping identify speeding patterns
- Speed Compliance Analysis: Compares compliant vs. non-compliant vehicles by direction using green/red color coding
- Speeding Patterns by Hour: Dual-axis charts combining total vehicle count with speeding percentage to optimize enforcement timing
๐ Vehicle Classification
- Vehicle Distribution: Bar chart showing the distribution of 6 FHWA vehicle classes by direction, supporting infrastructure planning and traffic composition analysis
Vehicle Classifications
The dashboard analyzes six FHWA vehicle classes:
- ๐๏ธ Class 1: Motorcycles
- ๐ Class 2: Passenger Cars
- ๐ Class 3: Pickups, Vans
- ๐ Class 4: Buses
- ๐ Class 5: 2 Axles, 6 Tires
- ๐ Class 6: 3 Axles